As at 30 June 2026
Fund values and investment return
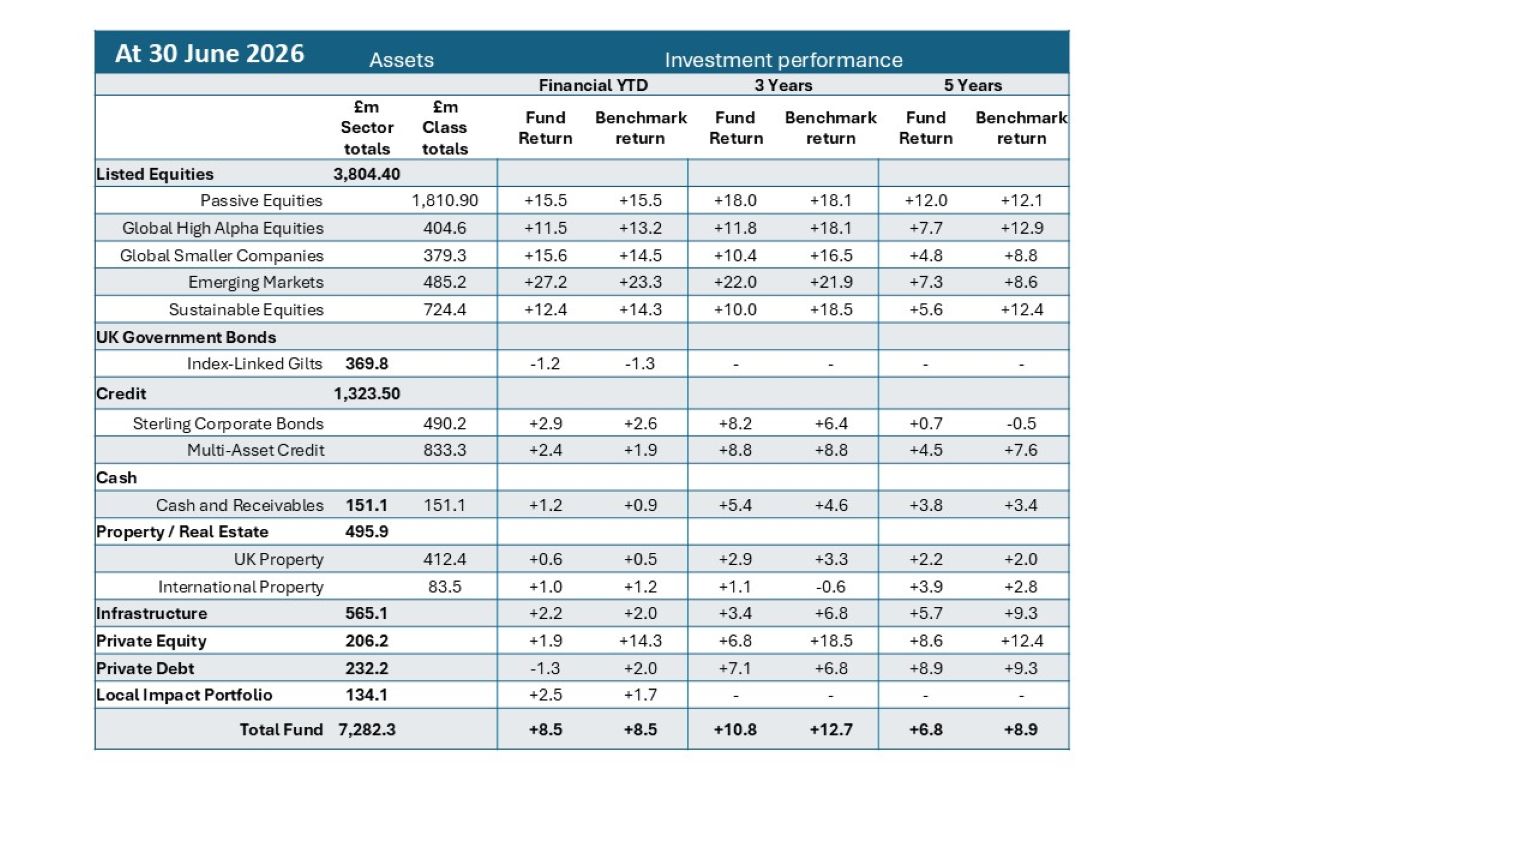
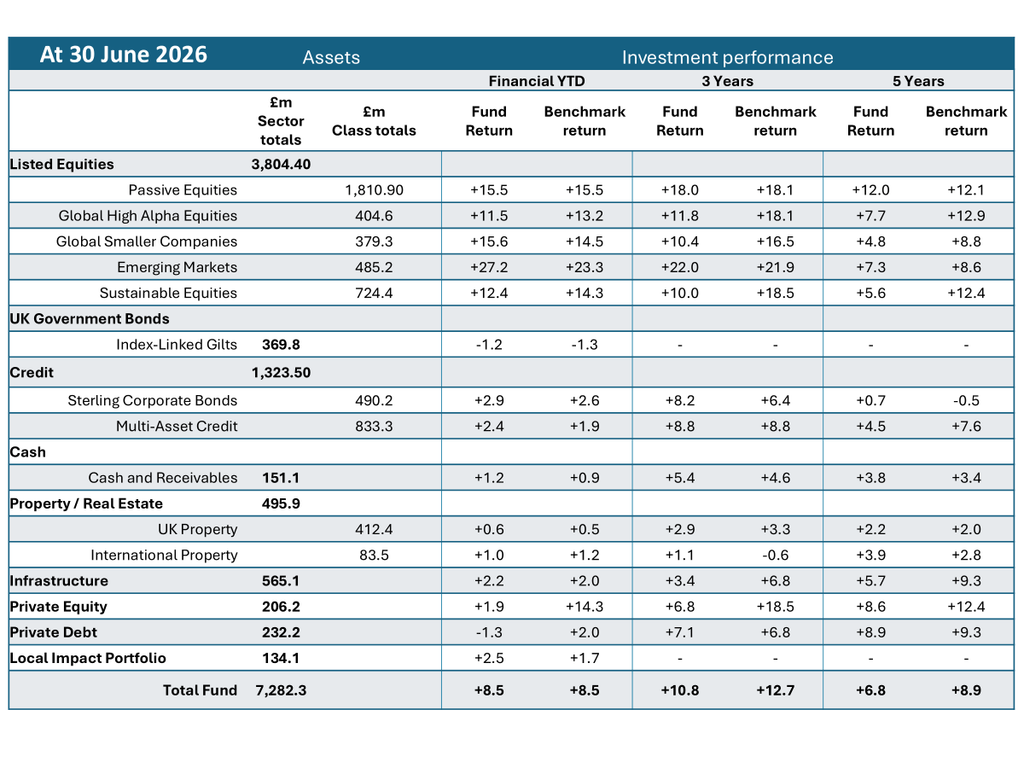
Key Points about investment performance
- Listed equities performed strongly, as markets bounced back from the falls during March resulting from the US decision to launch an attack on Iran, and the subsequent hostilities.
- The Emerging Markets and Global Smaller Companies equity portfolios performed ahead of benchmark over the quarter. The Global high Alpha and Sustainable Equities allocations continued to under-perform, with the biggest factor being an underweight to the technology sector, and in particular to Micron Technology which returned 178% over the period.
- Index Linked Gilts were negative over the period, as investors became less worried about future inflation as energy prices fell and inflation readings improved. That led to an increase in real gilt yields and a resulting fall in valuations.
- Sterling Corporate Bonds and Multi-Asset Credit Sterling corporate bonds, by contrast, benefited from improving investor confidence after Middle East tensions eased, causing corporate bond risk premiums (“spreads”) to narrow and bond prices to rise. Both delivered positive above benchmark performance.
- Property, Infrastructure and Private Equity all had low positive returns over the quarter. Private Equity lagged listed equity markets reflecting the early stage of the majority of investments. Private Debt showed a negative return from lagged valuations being marked to market. Any unrealised losses should be recovered as loans mature.
Overall Asset Allocation
The current asset allocation, compared to the target asset allocation, is shown in the table below:
| Asset | Target allocation (%) | Actual allocation (%) |
|---|---|---|
| Fixed interest and cash | 26.0 | 25.3 |
| Equities | 48.0 | 52.3 |
| Alternatives/Other | 26.0 | 22.4 |
Key points to note about Asset Allocation
- The Fund value as at 30 June 2026 stood at £7,282.3 million, an increase of just over £550 million over the last quarter, representing a return over the quarter of 8.5%.
- The increase was largely due to a good quarter for listed equities, which delivered returns of around 15% as markets rebounded from the initial losses following the US/Israel military action against Iran.
- As a result, the equity allocation was significantly overweight approaching the quarter end. While fixed interest and alternatives for the most part delivered positive returns, the equity performance meant that other asset classes fell below their target allocations.
- Under the revised LGPS investment regulations, rebalancing decisions are now the responsibility of our investment pool, LPPI, operating within the Advisory Management Agreement in place with the Devon Fund. LPPI decided to redeem £106 million from each of the Passive Equities and the Emerging Market Equities allocation, with £106 million invested in Multi-Asset Credit, £53 million invested in Index Linked Gilts, £16 million in Sterling Corporate Bonds, and £37 million retained as cash. These trades are not reflected in the above table, but were in progress over the quarter end.
- Within the Alternatives/Other heading, all the allocations are below target. In all cases except Property, there are still undrawn commitments which would take those investments up to their target levels, but this will take time. We are dependent on the fund managers identifying opportunities for investment which will result in further drawdowns of our capital.